Facilities and Equipment
The In Vivo Imaging Shared Resource uses a variety of severs and workstations for processing images acquired from the preclinical imagers. All of the imagers are linked to a Windows-based server. Two Unix- and Linux-based servers with CD-RW and DVD-R capability (SUN FireV100 or Pentium4 Linux) running Luminex® Disc Recording Software, are available for image processing, A web based archival database Fire Series® will be implemented to facilitate the large volume of image data that will be generated in the ICMIC to allow investigators the ability to store or retrieve their data remotely. We have two Sun workstations one with a 400 MHz UltraSPARCIIi 360MHz processor with 512 MB RAM and 100 GB IDE HD and 36GB Ultra320 SCSI HD and 24 bit graphics system and the other Sun Blade 150 with a 650 MHz UltraSPARC IIi 512MB RAM available for image fusion. Both systems operate IDL® 6.0 (Research Systems, Inc, Boulder Co) for image processing, kinetic modeling, parametric image formation and data visualization. These systems are networked to allow imaging devices.
Service
While much of the service can be provided in house, high-level computing will be expanded in the future through collaboration with the SDSC. The ability to acquire, transmit, process, archive, and manipulate image datasets for modeling, fusion, visualization, and interpretation, and the use of acquired or parametric images to guide intervention are important immediate and long term objectives. Specific services include:
- Image data storage and retrieval
- Dynamic image analysis and segmentation
- Kinetic analysis of image data and generation of parametric images
- Multimodality image fusion.
Image Archival and Retrieval
Image archival is provided by an
XeoByte 5-position magnetic tape carrousel which is attached to the Windows-based server that is intraneted to the imagers. A Unix-based server with CD-RW and DVD-R capability. Initially a low-end server such as SUN FireV100 or Pentium4 Linux running Luminex® Disc Recording Software is used for intermediate data storage. As demand increases a midrange server will be considered. A web based archival database Fire Series® will be implemented to facilitate the large volume of image data that will be generated in the ICMIC. The web-based feature will allow individual investigators the ability to store or retrieve their data remotely. The image data from the various projects include, 2D histology, 2D digital autoradiography, 2D Ultrasound, 2D optical, 3D X-ray CT, 3D MRI, 3D PET. Images acquired in a dynamic mode will have an additional time dimension.
Initially, a low end Unix or Linux server will be used to drive a Luminex® Disc-Recording system for data archival on CDROM or DVD. As the volume of data increase, the Unix or Linux server will be upgraded to a midrange server and used to provide user accounts, serve as a host for the database and database searches, and serve as a web access point for entry into the database. The web based user interface will be implemented from a commercial product (Fire Series®, Luminex, Inc) or developed in-house to simplify investigator access and retrieval of their image data from the image archive database. Eventually this service will be provided through the SDSC where disk storage is essentially limitless and data security, anonymity and preservation are well developed, particularly when handling patient data.
Multimodality Image Fusion
The multimodality image fusion will use the approach of Mutual Information. This technique is fully automatic and will allow 2D as well as 3D image fusion and does not require fiduciary markers or sources. This technique is also capable of registering non-rigid objects, so that the methods of elastic mapping can also be applied. This includes 2D as well as 3D digital image data from the various devices. The resource has modified existing software for image registration so that the new technique of Mutual Information can be applied as the similarity measure. Two-dimensional histological images can be registered to the 2D digital autoradiographic data from a phosphor imager. The tomographic optical images will allow image fusion to other functional (PET, MRI) and anatomical images (CT).

The general algorithm commonly used for image registration is similar to the one we have implemented as shown in Figure 14. As in most algorithms, the similarity measure is what is iteratively optimized (maximized or minimized depending on the type of similarity measure used).

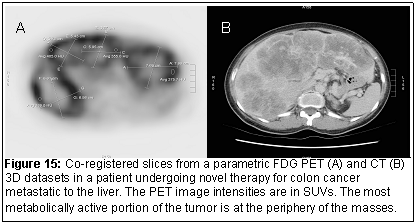
To apply the registration technique to images from different modalities (for example MRI and PET or CT and PET (Figure 15), we have kept the parameters needed for registration to a total of 6. The voxel size along the x, y, and z directions, (sx, sy, sz) should be known based on the DICOM image data headers. Computationally, this optimization can be handled by the Nelder-Mead simplex method and a fast workstation. Since the prior submission, additions to the existing code and the implementation of the Mutual Information criteria as the similarity measure has been implemented for multimodality image registration.
Data analysis software

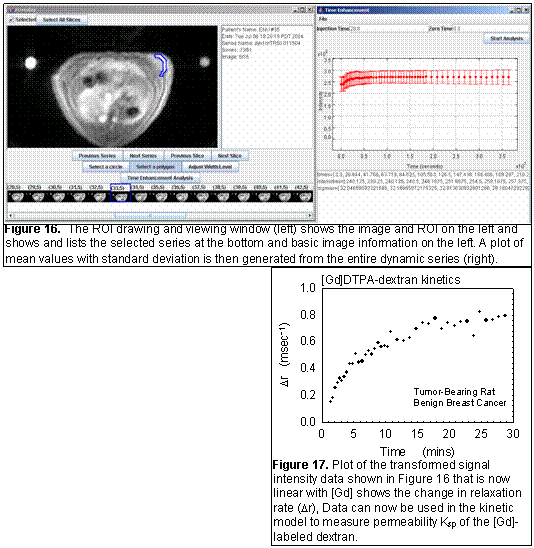
fOverlay is an in-house developed software tool for collecting region-of-interest (ROI) data from DICOM images (Figure 16). Current features include: fast DICOM reading, polygonal and circular ROIs, simple plotting of ROI averages, and exporting of time and average data for analysis with other software. Current development is focused on more general purpose data collection, saving ROIs for later review, export of data to relational databases, and more sophisticated ROI drawing, such as multiple slices to capture volumes-of-interest. The final implementation will automatically generate the transformed parameter of interest. For example in the MR example (Figures 16 and 17), the signal was transformed into a relaxation rate and plotted over time.
Dynamic or Kinetic Modeling of various molecular imaging agents
When employing kinetic modeling on a pixel-by-pixel basis, it is important that the 3D datasets acquired dynamically are properly co-registered since motion between acquisitions is inevitable. This requires not only translation and rotation but also morphing. We have in-house CADStream software (Confirma Inc., Kirkland, WA) operating on a Pentium IV XP that registers each dataset to a reference data set such that each tissue voxel is superimposed on the identical tissue voxel for the entire 3D dataset series. In-house software written in IDL® for Dynamical Modeling uses an UltraSPARC and a Pentium workstation.
The image data acquired in a dynamic mode adds the dimension of time in the data analysis. The techniques of dynamic modeling using the state-space equations written in IDL will allow a comprehensive and flexible approach to modeling the various dynamic images [1]
SSM (State Space Modeler, UCLA, Los Angeles, CA). A system of any size or complexity can be modeled as long as it can be defined by a set of differential equations. The estimation of the model parameters involves the calculation of the matrix exponential using the Pade’ approximation in an iterative algorithm [2]. The FDG 3-compartment model, N-13 2-compartment model, and O-15 flow model have already been implemented in SSM and are being used for a variety of projects at UCLA where they were originally developed and are currently being further developed at UCSD by Dr. Hoh.
There are several potential approaches to obtain the input function with new radiotracers. If the tracer has no significant myocardial uptake and minimal metabolism, then a simple left ventricular region of interest may be used with the appropriate correction for recovery coefficients and correction for plasma/blood equilibrium. The recovery coefficient for the left ventricular cavity will be obtained by accurate measurements of the left ventricle with ultrasound (see Ultrasound section). If there is significant myocardial uptake with the new tracer, then other organs with significant blood pool will be utilized. Since the 15 cm axial field-of-view of the scanner will image the entire mouse, all organ tissues (liver, spleen, kidneys, brain, aorta) are available for estimating the input function. Modifications to the method of Green et al [3], of using different target organs with blood pool and or tissue uptake are alternatives to obtaining the plasma input function.
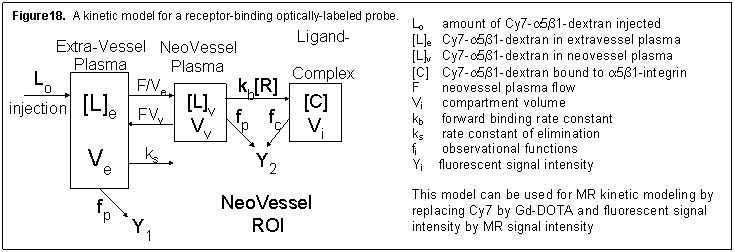
The model in Figure 18 is for an optically labeled receptor-binding probe. The Y1 input function data will be acquired by a fluorescent detector attached to the mouse’s tail. The Y2 observer will consist of time-domain data acquired from the optical imaging detector over the ROI and observational equations, represented by fp and fc, and will be modeled based on photon transport theory.

Using the 7T imager, we will acquire three pre-injection and serial post-injection volumetric images for 60 minutes. Time-enhancement curves will be analyzed using a three compartment kinetic model for the parameter estimation of tumor plasma flow F and kps [4, 5]. The latter parameter is an index of microvascular permeability and is a function of the agent’s diffusion coefficient [6]. Similar to the optical model (Figure 18), the MR model uses three compartments: extra-tumor plasma, tumor plasma, and tumor interstitium. We will independently estimate tumor plasma flow F and kps. The precision will depend on the relative magnitudes of F/Ve and kps [7, 8]. Consequently, the precision of the F/Ve and kps estimates will depend on the diffusion coefficients of each Gd-DOTA dextran, and hence, the molecular size of each agent. Additionally, we will include observational equations, represented by fp and fc, which are functions of proton density N(H), tissue T1 and T2*, TE and TR, the relaxation rate constants kr, as well as the gadolinium concentration. Both fp and fc relate [L]e, [L]p, and [L]t to MR signal intensities Y1, or Y2 via an equation defined by the acquisition pulse sequence [9]. Note that Y1 is the input function observed by MR sampling of the left ventricle (LV).
Generation of parametric images

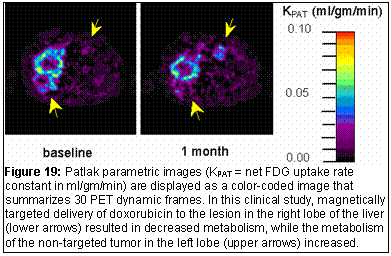
In-house software for generation of parametric images written in IDL® will help the investigators of the ICMIC interpret the large volume of image data in a compact and summarized form [10 -13]. For example with the PET radiopharmaceuticals, images can be generated where each image pixel represents a compartment model rate constant or overall net-uptake-rate constant (Figure 19).
- Hoh CK (1996), Dahlbom M, Gambhir SS, Yang J, Phelps ME. State space modeler (SSM): a general software package for dynamic systems modeling.
J Nucl Med 37: 303P.
- Cleve, M. and V.L. Charles, Nineteen dubious ways to compute the exponential matrix.
SIAM Rev, 1978. 20: p. 801-836.
- Green LA (1998), Gambhir SS, Srinivasan A, Banerjee PK, Hoh CK, Cherry SR, Sharfstein S, Barrio JR, Herschman HR, Phelps ME. Noninvasive methods for quantitating blood time-activity curves from mouse PET images obtained with fluorine-18-fluorodeoxyglucose.
J Nucl Med 39:729-734.
- Brasch R (1994), Shames D, Cohen F, Kuwatsuru R, Neuder M, Mann J, Vexler V, Muhler A, Rosenau W. Quantification of capillary permeability to macromolecular magnetic resonance imaging contrast media in experimental mammary adenocarcinomas.
Invest Radiol Suppl(2):S8-S11.
- Shames DM (1993), Kuwatsuru R, Vexler V, Muhler A, Brasch RC. Measurement of capillary permeability to macromolecules by dynamic magnetic resonance imaging: a quantitative noninvasive technique.
Magn Reson Med 29: 616-622.
- Jain RK (1988). Determinants of tumor blood flow: a review.
Cancer Res 48: 2641-2658.
- Vera DR (1985), Krohn KA, Schiebe PO, Stadalnik RC: Identifiability analysis of an in vivo receptor-binding radiopharmacokinetic system.
IEEE Trans Biomed Eng BME-13:311-322.
- Vera DR (1992), Scheibe PO, Krohn KA, Trudeau WL, Stadalnik RC: Goodness-of-fit and local identifiability of an
in vivo receptor-binding radiopharmacokinetic system.
IEEE Trans Biomed Eng BME-39:356-367.
- Vera DR (1995), Buonocore MH. A kinetic model for measurement of receptor concentration via magnetic resonance imaging of a paramagnetic contrast agent.
Ann Biomed Engr 23:S64.
- Patlak C (1983), Blasberg R, Fenstermacher J. Graphical evaluation of blood to brain transfer constants from multiple-time uptake data.J Cereb Blood Flow Metab 3:1-7.
- Patlak C (1985), Balsberg R. Graphical evaluation of blood to brain transfer constants from multiple time uptake data. Generalizations.J Cereb Blood Flow Metab 5:584-590.
- Choi Y (1991), et al. Parametric images of myocardial glucose utilization rate generated from dynamic cardiac PET-FDG studies.J Nucl Med 32: 733-738.
- Hoh CK (2002), Hawkins RA, Ramaswamy M, Venook A, Koda J. Quantitative FDG PET measuring preliminary biologic activity with a magnetically targeted therapy.
J Nucl Med 43:304P.