Materials
- Cells to be studied expressing green fluorescent protein (GFP). Note that the same cell type without GFP is needed as a control.
- Phospahte Buffered Saline (recipe link for PBS)
- Para-formaldehyde, (recipe link for 2% Stock)
- 70% Ethanol
- Propidium iodide stock solution (0.5 mg/ml in PBS)
- RNAse>
- 12 X 75 mm culture tubes
- Vortex mixer
- Ice bath
- Water bath at 37C
Protocol
Fix cells with formaldehyde
- Count cells.
- Place approximately 2 X 10⁶ cells into a 12 x 15 mm test tube and wash them once with PBS by centrifugation for 5 min at 300 x g at 4°C.
- Remove supernatant by aspiration and add 500 µl of cold PBS to the cell pellet. Mix gently. Add 500 µl of ice cold, buffered 2% formaldehyde solution and mix again. Incubate at 4°C for 10 minutes to 1 hour.
Lower concentrations of formaldehyde and short incubation times preserve more fluorescence.
Permeabilize cells with ethanol
- Spin cells down by centrifugation for 5 min at 300 x g at 4°C, remove supernatant by aspiration, wash once with cold 1 X PBS, then add 1 ml of 70% ethanol at -20°C drop-wise to the cell pellet with the tube sitting on a vortex. Incubate cell suspension overnight at 4°C.
Stain with propidium iodide
- Spin cells down by centrifugation for 5 min at 300 x g at 4°C, remove supernatant by aspiration and add 1 ml of a solution containing 40 µg/ml of PI and 100 µg/ml of RNAse. Incubate cell suspension at 37°C in the dark for 30 min.
- Transfer tubes to ice bath. If needed, filter samples through a nylon mesh (BD Cat #35-2340 or 35-2235) to remove clumps before acquisition on the flow cytometer.
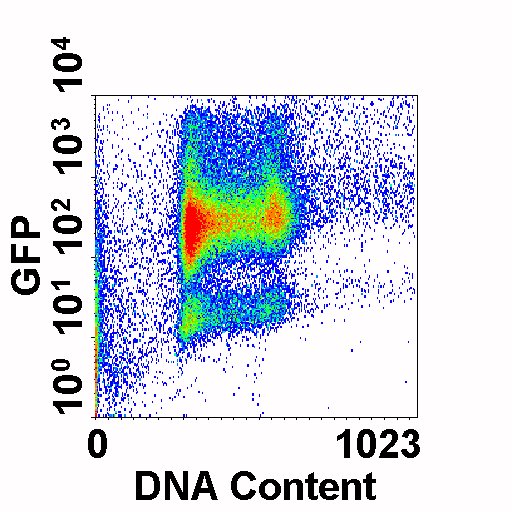
This is an example of cells expressing varying levels of GFP (y-axis) versus DNA Content (PI, x-axis)
References
- Chu, YW, Wang R., Schmid I, Sakamoto KM. Analysis with flow cytometry of green fluorescent protein expression in leukemic cells. Cytometry 36:333-339, 1999.
- Schmid I. and Sakamoto KM. Analysis of DNA content and green fluorescent protein expression. In: Current Protocols in Cytometry, Vol 1, Robinson JP, Darzynkiewicz Z, Dean P, Orfao A, Rabinovitch P, Stewart C, Tanke H, Wheeless L, eds., John Wiley & Sons, 2001, pp. 7.16.1-7.16.10.