Reagents
Fixative:
- Hank's Balanced Saline Solution (HBSS, Sigma H1387 or H8264)
- 70% EtOH (-20°C)
Extraction Buffer:
- 45 mM Na2HPO4
- 2.5 mM citric acid
- 0.1% Triton X-100
- pH 7.8
Staining Solution:
- 10 mM PIPES (Sigma P1851)
- 100 mM NaCl
- 2 mM Mg2Cl
- 0.2 % Triton X-100
- 50 µg/ml Propidium Iodide (PI)
- 50 units/ml RNAse (1:17.2 of 10 mg/ml, DNAse-free)
- pH 6.8
Fixation
Add dropwise 2 X 10⁶ cells in 500 µl of ice-cold HBSS to 4.50 ml of 70% EtOH at -20°C while slowly vortexing. Do not substitute PBS for HBSS.
Cells should be stored for at least 24 hrs at 4°C. Cells can be stored at -20°C for at least 2 weeks.
Extraction
- Centrifuge tubes at 400 X g for 10 minutes, then aspirate supernatant.
- Resuspend pellet in 200 µl of Extraction Buffer.
- Incubate for 20 min at 37°C.
Volume or time may need to be varied for optimal extraction.
Optional: Wash cells by centrifugation (as above in HBSS) before and/or after Extraction. If there is extensive fragmentation, Extraction Buffer may need to be diluted with HBSS to prevent over extraction.
Stain
- Add 300 µl Staining Solution to above cell suspension.
- Transfer to Falcon® 12 X 75 mm Polystyrene round-bottom tubes (Cat #[35]-2054) if different tubes were used above. Falcon® Cat. No. [35]2235 have nylon filter caps and will remove clumps.
- Incubate 30 minutes room temperature, then place on ice bath protected from light.
Notes
- Sub G1 peak can also represent mechanically damaged cells.
- Post-G1 cells that lose DNA may still have greater DNA content than G1 cells.
- Detergent permeabilization can be used instead of fixation.
- Formaldehyde fixation (cross-linking) precludes low molecular weight DNA extraction.
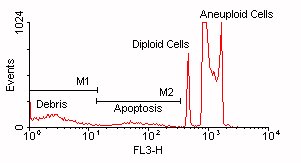
Click above figure for larger version (35,166 bytes)
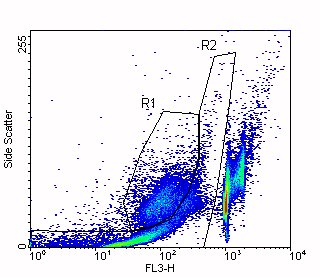
In this figure, you can see that the debris and apoptotic cells overlap in the DNA Content parameter (FL3-H). Region R1 indicates the apoptotic cells and Region R2 indicates the debris.
References
- Darzynkiewicz,Z, Flow Cytometry: Methods in Cell Biology, Volume 41, page 27 1994.
- Hotz, MA, Gong, J, Traganos, F, Darzynkiewicz, Z, Flow Cytometric Detection of Apoptosis: Comparison of the Assays of In Situ DNA Degradation and Chromatin Changes, Cytometry 15:237-244 (1994).